We want to find out, how we are currently situated with the performance utilization of our 3PAR storages. I imagined, that for this, we have to compare the maximum possible IOPS number to the currently load of IOPS.
For the max. possible IOPS, I refer to the max front-end IOPS which is indicated by the NinjaSTARS for 3PAR Tool. We have three 3PAR Storages. Two identically configured StoreServ 7200 and one StoreServ 8200.
The StoreServ 8200 is provided with 6 x 1.92TB SSD SFF, 48x 1.2TB SAS 10k SFF and 24x 6+TB NL 7.2k LFF. With the configured R/W balance of 60% Read, Cache Hits of 75% Read (yes it’s really high, but I have verified it multiple times) and 5% for AFC, the Ninja Tool indicates me a number of max front-end IOPS of 90,583.
Attachment:
File comment: StoreServ 8200 - Ninja Tools
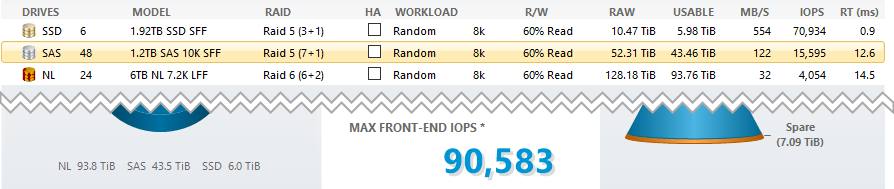 StoreServ8200.png [ 28.08 KiB | Viewed 25436 times ]
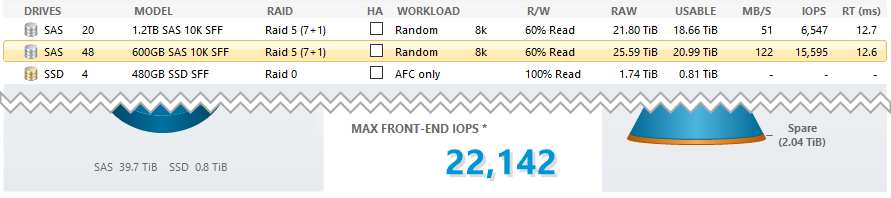
Both StoreServ7200 have 4x 480GB SSD SFF (primary for AFC, but AFC does not need the whole space, so I have a small R5 volume too), 48x 600 SAS 10k SFF and 20x 1.2TB SAS 10k SFF. For these storages, the Ninja Tool (same settings as before) comes up with max front-end IOPS of 22,142. I used the 8200 model in the Ninja Tools for this configuration to, because in this version the 7200 model isn’t available and in the older version of the Ninja Tools it isn’t possible to configure only 4 SSD for AFC. I suppose due to the older controller model, the indicated IOPS number is probably a bit lower.
Attachment:
File comment: StoreServ 7200 - Ninja Tools
 StoreServ7200.png [ 22.1 KiB | Viewed 25436 times ]
So here come my questions:
Can I rely on the, from the Ninja Tool indicated number as max IOPS for my storages?
Which report do I have to use, to get the currently IOPS load of the whole storage array?
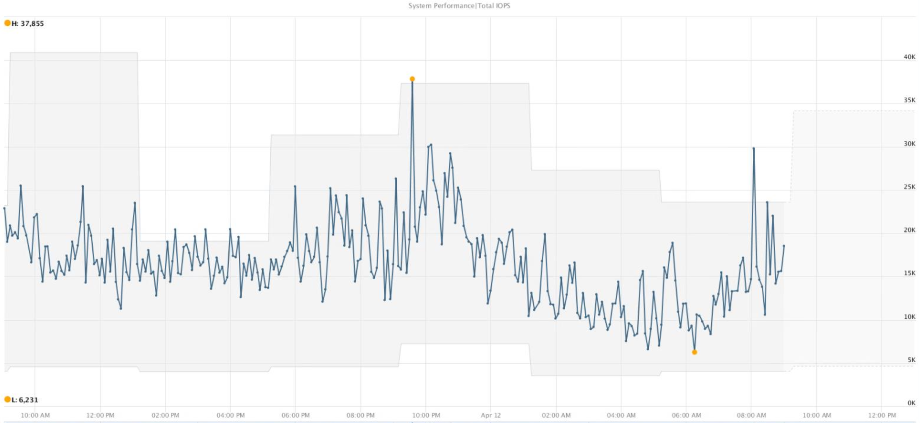
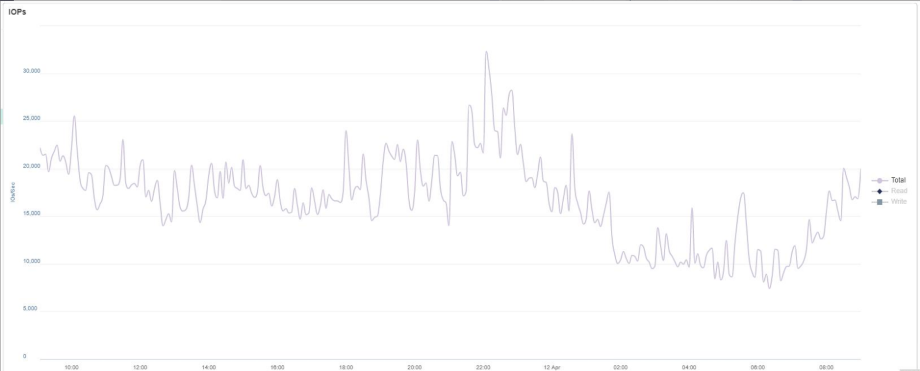
We are using also VMware vRealize Operations Manager with the HPE Storage Plug-in (former HPE StoreFront Analytics Management Pack), which monitors 3PAR data through the StoreServ SMI-S provider. This plugin gives me a pretty high number of Total IOPS. The only reports in the StoreServ Management Console, which shows me similar high values, are the Host Port Performance respectively the Enclosure Port Performance with all of the ports selected.
Is this the IOPS number I can compare to the max IOPS from the Ninja Tool?
Attachment:
File comment: vRealize Operations - Array Total IOPS
 vrops_total_iops.png [ 158.17 KiB | Viewed 25436 times ]
Attachment:
File comment: SSMC Report - Enclosure Ports - Total IOPS
 SSMC_enc_ports_total_iops.png [ 72.93 KiB | Viewed 25436 times ]
Thank you for your time and help.